d3 — Selections on associative containers/Objects/dicts

Tags

, , ,

Assume that you have a table with the ID entries and some data to fill the table in.

testdata = [
    {
        "name": "FEF talk",
        "setlength": 26,
        "setupdated": 1416993386.312,
        "setcreated": 1418404269.312,
    },
    {
        "name": "Crossing the Bright Void",
        "setlength": 1965,
        "setupdated": 1419542176.312,
        "setcreated": 1339072018.312,
    },
    {
        "name": "Definitely Not A Test Entry",
        "setlength": 1,
        "setupdated": 1366405260.127,
        "setcreated": 1334816591.312,
    },
    {
        "name": "Lorem ipsum dolor sit amet",
        "setlength": 33,
        "setupdated": 1416993386.312,
        "setcreated": 1413133869.312,
    }
]

You want to make the table have one row per Object, with the columns being “Name”, “Length”, “Updated date”, and “Created date”.

It seems like this code should work…

var UpdateDOM, init, testdata;
testdata = [{
    "name": "FEF talk",
        "setlength": 26,
        "setupdated": 1416993386.312,
        "setcreated": 1418404269.312
}, {
    "name": "Crossing the Bright Void",
        "setlength": 1965,
        "setupdated": 1419542176.312,
        "setcreated": 1339072018.312
}, {
    "name": "Definitely Not A Test Entry",
        "setlength": 1,
        "setupdated": 1366405260.127,
        "setcreated": 1334816591.312
}, {
    "name": "Lorem ipsum dolor sit amet",
        "setlength": 33,
        "setupdated": 1416993386.312,
        "setcreated": 1413133869.312
}];

init = function () {
    return UpdateDOM(testdata);
};

UpdateDOM = function (data) {
    var table;
    table = d3.select("#entries");
    return table.selectAll("tr").data(data).enter()
    .append("tr")
    .attr("class", "entry")
    .selectAll("td")
    .data(function (d, i) {
        return d;}).enter()
    .append("td").... ??
};

init();

But then you realize that objects don’t work nicely with the selection. d3 works on the assumption that your data is an array somehow. For example, if you have an array of ten elements, then it binds each element to whatever you’re appending, be it a <p>, <td>, or <tr>. Dicts/objects/associative arrays can’t be as easily be bound to elements–which part of a <td> becomes the key, and which part becomes the value?

To solve this, d3 has a function called d3.entries(), described here. In short, it turns your dictionary into an array of objects, each object containing a key and value pair. You can preserve key and value relationships, and even ensure the order of the keys are always the same.

Here is a link to a JSFiddle demonstrating the function, and below is the code for UpdateDOM().

var UpdateDOM, init, testdata;

testdata = [{
    "name": "FEF talk",
        "setlength": 26,
        "setupdated": 1416993386.312,
        "setcreated": 1418404269.312
}, {
    "name": "Crossing the Bright Void",
        "setlength": 1965,
        "setupdated": 1419542176.312,
        "setcreated": 1339072018.312
}, {
    "name": "Definitely Not A Test Entry",
        "setlength": 1,
        "setupdated": 1366405260.127,
        "setcreated": 1334816591.312
}, {
    "name": "Lorem ipsum dolor sit amet",
        "setlength": 33,
        "setupdated": 1416993386.312,
        "setcreated": 1413133869.312
}];

init = function () {
    return UpdateDOM(testdata);
};

UpdateDOM = function (data) {
    var table;
    table = d3.select("#entries");
    return table.selectAll("tr").data(data)
         .enter()
         .append("tr")
         .attr("class", "entry")
         .selectAll("td")
         .data(function (d, i) {
            return d3.entries(d);})
         .enter().append("td")
         .attr("class", function (d) {
            return d.key;})
         .text(function (d) {
            return d.value;});
};

init();

“Flashpages” concept

A friend of mine gave me the idea for a web app–flashpages! Conceptually, they would be very similar to flashcards commonly available all over the web, but with a few differences. The first is that there would be either no size limit or a very large one. The second is that it would support Markdown so that a user could format the flashcard, be it bolds, italic, bullets, lists, or even embedded images and links.

These are the design goals for my web app:

  1. A decently secure design–no plaintext passwords or data in querystrings.
  2. Leverage the main advantage of a web app–no installation or client-side storage is needed. All data should be loaded from the server.
  3. Create flashcards with two sides, a “front” and a “back”. When the set of flashcards are shuffled, the front side of a selected card is presented first, then the backside.
  4. Let the user put flashcards into sets, then shuffle the order of the cards and view them. Also, have a link to share the set of cards, and set whether anyone can view them or only the user.

The pages or states I will have to code consist of the following:

Login

I’ve been unable to figure out how to activate the SSL module of Cherrypy, so this is a crucial weakness in my security. Any passwords entrusted to me are insecure from start to finish–an attacker could inject javascript into my page or become a man-in-the-middle and intercept passwords. I can only provide the least amount of security without SSL: hash the password client-side and hope nobody will try to intercept it. While I should be figuring out how to enable SSL, my efforts are better put towards finishing the rest of the app first.

The hashed password and plaintext id are sent to the server, where the hash is matched against the one in the database. If it is correct, a random 64 character session ID is created and put into webstorage, possibly sessionStorage. For every request after this one, the client sends this session ID. The ID expires server-side after a set number of minutes with no requests or actions. Requests or actions refresh the reset duration.

Profile

This is a password-protected area. A list of the user’s flashcard sets is displayed, along with data such as the number of cards in it or the creation and last edited date, and the option to sort by any of the columns. There also will be an icon that indicates the publicity of a set (anyone can edit, anyone can see, only I can see). Sets can be deleted or renamed from this page.

Set editor

Clicking the name of a set in the Profile page will bring the user to this one. Displayed is a list of flashcards in this set. The flashcards would either be numbered, or the user can name them. If technology allows, a preview of each flashcard will be displayed. The user may click a button that enters flashcard using mode, or click on a card to edit it. Additionally, the “privacy” of this flashcard set can be set: anyone can see it using the link, only the user can see it, or anyone can edit the set. Finally, a button that copies the link to the set, to the clipboard will be available.

Flashcard usage

Cards are randomly drawn from the set and the Front side is presented, where the raw markdown is converted to HTML. The user can click on the card to “flip” it and see the Back side, then click once more to go to the next randomly drawn card OR left click/click a button to go back to the front side. The random drawing should have a mechanism to prevent the same card appearing too frequently, or even enforce card order so that it’s impossible for the same card to appear again until all the cards are viewed.

Flashcard editor

This page is simple: a textbox where the user can input Markdown-formatted content, and a section of the page where a “live preview” (as soon as the user finishes typing, the preview updates) exists. A toggle will let the user flip between front and back. A “save” button sends the content to the server to be stored and retrieved later which also sends the user back to the Set editor page. Each flashcard also has its own privacy settings and link; the former overrides that of the set(s) the flashcard is in.

Future possible features

  • History of drafts saved
  • SSL(!)

Currently, I am using Cherrypy (Python) for the backend server logic, Coffeescript to compile into Javascript for the client, and d3.js for its DOM manipulation and data features. I don’t use jQuery only because I don’t have much experience in it, and I would prefer to deepen my expertise in d3 rather than shallowly know both jQuery and d3.

pyeuclid: Rays don’t work as they should

Tags

, , , , , ,

pyeuclid is a good library at first glance. It provides functions for 3D geometry, including intersection tests and vector math, along with quaternions and matrices. But looking at the code:

def _intersect_line3_sphere(L, S):
    a = L.v.magnitude_squared()
    b = 2 * (L.v.x * (L.p.x - S.c.x) + \
             L.v.y * (L.p.y - S.c.y) + \
             L.v.z * (L.p.z - S.c.z))
    c = S.c.magnitude_squared() + \
        L.p.magnitude_squared() - \
        2 * S.c.dot(L.p) - \
        S.r ** 2
    det = b ** 2 - 4 * a * c
    if det < 0:
        return None
    sq = math.sqrt(det)
    u1 = (-b + sq) / (2 * a)
    u2 = (-b - sq) / (2 * a)
    if not L._u_in(u1):
        u1 = max(min(u1, 1.0), 0.0)
    if not L._u_in(u2):
        u2 = max(min(u2, 1.0), 0.0)
    return LineSegment3(Point3(L.p.x + u1 * L.v.x,
                               L.p.y + u1 * L.v.y,
                               L.p.z + u1 * L.v.z),
                        Point3(L.p.x + u2 * L.v.x,
                               L.p.y + u2 * L.v.y,
                               L.p.z + u2 * L.v.z))

It’s very difficult to figure out what’s going on here. In short, this code checks for an intersection between a sphere and a line. It always returns a LineSegment3 even if there is no intersection–in that case, it returns a LineSegment3 between (0,0,0) and (0,0,0).

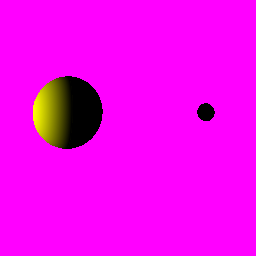
It gets worse, though. Consider this image:

strangeshadow1

The light is coming from the left side of the image. The large sphere casts a shadow on the small sphere…but the small sphere casts on on the large sphere, too. Wait, what?

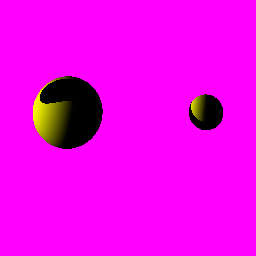
It’s more obvious in this image:

strangeshadow2

The shadow-casting code in this situation uses a Ray3 to detect for a collision between each point on a sphere and every object in the scene, including itself.

args: rayToLight, objects
for object in objects:
    i= object.intersect(rayToLight)
    if intersected(i): # checks that the line segment is significant
        getShadowColor()
    getObjectColor()

intersected() does a number of things: if the ray is on the surface of the object, intersect() returns a LineSegment3, so it checks that the length of LineSegment3 is below a certain amount. All other cases are counted as being in shadow. But pyeuclid has a serious problem in its intersection math: rays are treated like lines when doing intersection tests. This means that in the following situation

(SPHERE) [ray start]-------------&gt;

calling intersect() will return a line segment, even though it should return None. The relevant code is this:

def _intersect_line3_sphere(L, S):
    a = L.v.magnitude_squared()
    b = 2 * (L.v.x * (L.p.x - S.c.x) + \
             L.v.y * (L.p.y - S.c.y) + \
             L.v.z * (L.p.z - S.c.z))
    c = S.c.magnitude_squared() + \
        L.p.magnitude_squared() - \
        2 * S.c.dot(L.p) - \
        S.r ** 2
    det = b ** 2 - 4 * a * c
    if det < 0:
        return None
    sq = math.sqrt(det)
    u1 = (-b + sq) / (2 * a)
    u2 = (-b - sq) / (2 * a)
    if not L._u_in(u1):
        u1 = max(min(u1, 1.0), 0.0)
    if not L._u_in(u2):
        u2 = max(min(u2, 1.0), 0.0)
    return LineSegment3(Point3(L.p.x + u1 * L.v.x,
                               L.p.y + u1 * L.v.y,
                               L.p.z + u1 * L.v.z),
                        Point3(L.p.x + u2 * L.v.x,
                               L.p.y + u2 * L.v.y,
                               L.p.z + u2 * L.v.z))

The code obliterates the difference between a line, ray, and line segment. Presumably, when u>=0 it is a ray, and 0<=u<=1 is a segment. Other cases are exclusively for lines.

With the help of an anonymous person on IRC, the code has been modified to this:

def _intersect_line3_sphere(L, S):
    a = L.v.magnitude_squared()
    b = 2 * (L.v.x * (L.p.x - S.c.x) + \
             L.v.y * (L.p.y - S.c.y) + \
             L.v.z * (L.p.z - S.c.z))
    c = S.c.magnitude_squared() + \
        L.p.magnitude_squared() - \
        2 * S.c.dot(L.p) - \
        S.r ** 2
    det = b ** 2 - 4 * a * c
    if det < 0:
        return None
    sq = math.sqrt(det)
    u1 = (-b + sq) / (2 * a)
    u2 = (-b - sq) / (2 * a)
    if not L._u_in(u1):
        u1 = min(u1, 1.0)
    if not L._u_in(u2):
        u2 = max(u2, 0.0)
    if u1 < u2:
        return None
    return LineSegment3(Point3(L.p.x + u1 * L.v.x,
                               L.p.y + u1 * L.v.y,
                               L.p.z + u1 * L.v.z),
                        Point3(L.p.x + u2 * L.v.x,
                               L.p.y + u2 * L.v.y,
                               L.p.z + u2 * L.v.z))

goodshadow

The problem is fixed.

bettershadow

Additionally, other shadows work as well, too.

Link to forked repo, as the fork I was using had not been maintained since 7 months ago.

Prefix expression evaluator

Tags

,

Have you ever wished you could define simple formulas in a data file, then load it into your program and execute them? Perhaps you want even the deeper mechanics of a game to be exposed for easy editing. A scripting language is normally used for this task–such as Lua, one of the most popular languages for game-related scripting. I didn’t feel like I wanted to include a scripting language within my supposedly simple project because working around the Lua language and whatever Python library used to embed it seemed like a pain. Instead, I decided to code an expression evaluator from scratch for my own needs.

There are many ways to represent a formula. The method we are most familiar with looks like this:

y = x^2 + x + \sqrt{x}

Sadly, this is also the most complicated to interpret–from flat notation, a parsing tree must be constructed, depending on parentheses and operation precedence. Postfix and prefix expressions are easier to parse.

− × ÷ 15 − 7 + 1 1 3 + 2 + 1 1

In this example of prefix expressions, from Wikipedia, the operation precedence doesn’t matter. Reading from the back, each operator takes 2 operands until the stack only has 1 element.

In my evaluator, I use explicit operator order to completely remove ambiguity and also make it easier to code quickly. From now on, I shall refer to my version of prefix expressions as a prefix tree. Here is an example of a prefix tree:

["-", ["*", "$b", "$b"], ["*", 4, "$a", "$c"]]

It would be stored in a data file, preferably json, so that the Python json parser can turn that expression directly into Python objects.

{
    "determinant": ["-", ["*", "$b", "$b"], ["*", 4, "$a", "$c"]]
}

Calling the handler:

from prefix import PrefixHolder
#...
foo = 3
bar = 9
#...
ph = PrefixHolder(expression)
result = ph.evaluate({ "b": foo, "a": 1, "c": bar })

The evaluate() function accepts a dictionary containing the variables to use in the expression.

Operators that are commutative–such as + or *–can accept any number of operands, while non-commuting operators such as – or / only accept 2 operators. Other “operators” are available, such as “sqrt” which accepts one variable and (planned) “range” to return a random number within the specified operand limits. It is also possible to add operators with no operands, to be used as constants.

Here’s one more example of a prefix tree:

{
    "positive_root": ["/", ["+", ["*", "$b", -1], ["sqrt", ["-", ["*", "$b", "$b"], ["*", 4, "$a", "$c"]]]], ["*", 2, "$a"]]
}
>>> e = PrefixHolder(["/", ["+", ["*", "$b", -1], ["sqrt", ["-", ["*", "$b", "$b"], ["*", 4, "$a", "$c"]]]], ["*", 2, "$a"]])
>>> e.evaluate({ "a": 1, "b": -4, "c": 4})
2.0

Incidentally, I tried to use test-driven development while coding this small library. Generally, I created classes with dummied-out functions that return None, then coded tests for each functionality. The Python standard library unittest was a great help, along with its comprehensive documentation here. Although some programs would be difficult to do full TDD, unit tests in general are a pretty useful tool.

Here are the tests used. Unit tests are almost exactly like the manual testing done to make sure everything works properly, except that they are in a different part of the code, instead of being ran in main() or main then deleted after it works. I think I see myself using more unit tests in the future.


link to prefix.py

Visualizing the human chromosome

Tags

, , ,

Chromosome no21

Chromosome no21

The idea for this project was spawned from a random conversation with a classmate of mine. The topic was, “How big would an image that uses one pixel for one base pair for the entire human genome be?” The answer to that question is, for the curious, around 14.7 x 14.7 meters on your typical 96 dpi monitor. But this sort of visualization tends to look like this — high-contrast and eye-straining, with little pattern discernible. In fact, there are two choices that make the linked visualization less-than-optimal. One, even though Adenine/Thymine and Guanine/Cytosine are quite related in the grand scheme of things, the drastically different coloring of them makes relating them hard. Two, because the pixels are placed horizontally, two pixels that are adjacent are not very close to each other at all. Related to this point, the ‘interesting patterns’ that appear are entirely arbitrary, depending on the width of the image and the strain it puts on the human eye.

I remember a task on Rosalind that had you count the ratio of G and C to the total. Rosalind is a very recommendable website that introduces a beginner programmer to string-related problems from the real world. In fact, most of the tasks on Rosalind are actual ones encountered in biometrics. I decided that grouping up a number of base pairs and representing them as a single pixel, shaded depending on its GC content would be better. In fact, areas with high GC content(called GC islands) are very helpful in annotating genes.

The shading itself is also an issue. Simple RGB interpolating is rather bad. RGB interpolation tends to be unintuitive compared to what you’d expect. The default gradient displayed here shows that colors dim and grey between purple and green. The Lab scheme I ended up using also still has problems in blending (colors lose saturation), but it also has a great advantage over Lch and RGB, in that it’s possible to construct linear gradients that start as one color, become white in the middle, then become another color at the end. In my opinion, this is a great feature of Lab that justifies using it over the superior Lch color space.

The raw data for the human genome was pulled from the Human Genome Project, hosted at Project Gutenburg.


First, I need to count the base pairs in a given chromosome’s sequence file. Looking at chromosome 21’s file(WARNING: VERY LARGE FILE, 46.7 MB), chosen because it’s the smallest chromosome, there are about 378 lines of preamble before the actual sequence starts. The first line of the sequence is leaded by the following text:

>chr21 Homo sapiens chromosome 21

Hmm–this gives me a hint on how to start processing the text. I take a look at the Y chromosome’s file, too (found here, also very large at 70.2 MB), and find the line

>chrY

Both lines are at line 379 of both files, but I decide to use “a greater-than sign followed by text” as the starting point of nucleotide processing. This also provides a handy way to name the resulting file–split the line with a > by spaces then remove the > of the first split string.

aligned = False
outname = ""
counter = 0
for line in file:
    counter += 1
    if counter % 10000 == 0:
        print counter
    if not aligned:
        if line[0] == ">":
            txts = line.split(" ")
            print "Checked: " + txts[0]
            outname = txts[0].strip()[1:]
            aligned = True

That explains this section of the script. The variable aligned is to enable my program to switch between “scan file for start of nucleotide sequence” mode and “process nucleotides” mode; counter was added later to show progress instead of a supposedly frozen console.

Next, I look at the bulk of the file (chr21 is 898531 lines long!). Each line has at most 50 chromosomes on it. I want to let the script use an arbitrary number of base pairs per pixel, so I code a ‘buffer’ that, when full, generates the data for a pixel then empties.

    else:
        group += line.strip()
        if len(group) >= pixelsize:
            GC = AT = N = 0
            working = group[:pixelsize] # Copy the base pairs to work on.
            group = group[pixelsize:] # Remove the worked-on pairs.
            for dna in working:
                if dna == 'A' or dna == 'T':
                    AT += 1
                elif dna == 'G' or dna == 'C':
                    GC += 1
                elif dna == 'N':
                    N += 1
                else:
                    unknowns.append(dna)
            info = []
            if AT+GC == 0:
                info.append(0.0)
            else:
                info.append(GC/float(AT+GC))
                
            if N != 0:
                info.append(N/float(pixelsize))
            ratios.append(info)

Something very noticable in chr21 is that the first couple 225 thousand lines are all

NNNNNNNNNNNNNNNNNNNNNNNNNNNNNNNNNNNNNNNNNNNNNNNNNN

This isn’t in the five nucleotides most people know of, which are Adenine, Thymine, Guanine, Cytosine, and Uracil. The answer to this problem (which took me somewhere between ten and thirty minutes to figure out, due to ‘N’ being an extremely common letter) can be found here. Basically, N represents nucleotides that differ from person to person, as the Human Genome Project sequenced multiple unique genomes to produce its final report. In my visualization, Ns are represented by interpolating between black and whatever color the pixel is after considering GC content.


Using the Python library Image to plot the data linearly (that is, left-to-right, top-to-down in order) looks like this:

chr21line

Like I mentioned above, this is not a very good visualization. Pixels are tiny, and the difference between two vertically adjacent ones is on the order of 47400 base pairs. To remedy this, I use the Hilbert curve.

From Wikipedia

The Hilbert curve is a space-filling curve, and makes sure adjacent points are also fairly close to each other along the length of the curve.

From Wikipedia

The difference between two adjacent points because exponentially larger depending on which ‘square’ the two points are in, as illustrated in the above image. This happens because the Hilbert curve is a recursive, fractal curve, but is still a great improvement over the linear layout where every line is a huge jump.

The code I use to generate a list of Hilbert points is borrowed from Malcolm Kesson at http://www.fundza.com, with slight edits to store coordinates in a list rather than print to the screen.

def hilbert(x0, y0, xi, xj, yi, yj, n, coords):
    if n <= 0:
        X = x0 + (xi + yi)/2
        Y = y0 + (xj + yj)/2

        # Output the coordinates the cv
        coords.append((X,Y))
    else:
        hilbert(x0, y0, yi/2, yj/2, xi/2, xj/2, n - 1, coords)
        hilbert(x0 + xi/2, y0 + xj/2, xi/2, xj/2, yi/2, yj/2, n - 1, coords)
        hilbert(x0 + xi/2 + yi/2, y0 + xj/2 + yj/2, xi/2, xj/2, yi/2, yj/2, n - 1, coords)
        hilbert(x0 + xi/2 + yi, y0 + xj/2 + yj, -yi/2,-yj/2,-xi/2,-xj/2, n - 1, coords)

A 0^th order Hilbert curve has 1 point; a 1^st order Hilbert curve has 4 points, a 2^nd order Hilbert curve has 16 points, and so on. To determine how many points are needed–that is, what N in N^th order Hilbert curve I need, I use simple math.

powers = int(math.ceil(math.log(math.sqrt(len(ratios)))/math.log(2)))
size = 2**powers

… Perhaps not so simple. Here it is using Latex markup:

n = \lceil\log_2 \sqrt L \rceil

L is the length of the current chromosome. I take the square root of it to find the length of a square that would have area of L, then take the logarithm of that and ceil() it to find n so that 2^n has an area of at least L.


Now we have a list of points, ordered so that if they are popped from the front and a line drawn they would draw a Hilbert curve. Next up is actually drawing the pixels.

exceptions = 0
for d in xrange(len(ratios)):
    if d % 10000 == 0:
        print d,"/",len(ratios)
        
    if mode == "lab":
        col = lerpLab(ATColor, GCColor, ratios[d][0])
    else:
        col = lerpLch(ATColor, GCColor, ratios[d][0])

    if len(ratios[d]) > 1:
        if mode == "lab":
            col = lerpLab(col, black, ratios[d][1])
        else:
            col = lerpLch(col, black, ratios[d][1])
    # translate Lab/Lch to RGB colors
    r,g,b = conversions.convert_color(col, colors.sRGBColor).get_value_tuple()      
    # Some Lab/Lch colors can't be represented using RGB.
    if r < 0.0:
        r = 0.0
    if g < 0.0:
        g = 0.0
    if b < 0.0:
        b = 0.0
    if r > 1.0:
        r = 1.0
    if g > 1.0:
        g = 1.0
    if b > 1.0:
        b = 1.0
        

    x, y = coords[d]
    
    try:
        pixels[x,y] = (int(r*255),int(g*255),int(b*255), 255)
    except IndexError:
        print x,y
        exceptions+=1

exceptions is a counter of out-of-bounds exceptions, which I had some trouble with before realizing that Hilbert curves needed to have squares that are 2^n in side length to be all integers. Again, I print the current progress along with the total number of things to process (which I now know, having read in the whole file), and finally decide the color of each pixel.

lerpLab and lerpLch are simple functions that interpolate linearly between the two given colors by t, so that when t=0 the result is 100% Color1, and when t=1 the result is 100% Color2. I use colormath for Lab color calculations and converting to RGB.

img.save("output/" + outname + ".png")

And the image is produced.

Chromosome no21

Chromosome no21

Areas that are close on the image tend to be close on the actual chromosome, too. Blue areas are also more visible than the linear version, indicating the presence of GC islands, which are typically 4 blue spots together.

I plan on making a slightly more interactive version of the image with Javascript, to display the sequence at a pixel when clicked, in order to let the user search for the sequence using BLAST].


Repository here.
Creating a ‘dynamic’ image — DFHack .40.xx progress bar

Tags

, ,

progressbar

Last week, a friend of mine asked if I could make him a sort of progress bar by analyzing a file and extracting the number of VERIFIED, ALIGNED, andUNCHECKED` strings. The file was a text one included in the repository of DFHack, a program that scans the memory of a game called Dwarf Fortress in order to enable plugins, usually for convenience. It does that by manually checking the position and structure of the memory objects of DF, which radically change after every version release.

In the DF Hack repository, there is a file that lists the status of the thousand or so data structures. In order to make an image that reflected changes to the file, I had to (1) get the data file, (2) scan it for the correct data, (3) create the correct image, and (4) host it on a server that can be hotlinked to.


First, I decided to use Python for this task. I am somewhat experienced in Python, and I also know that Python has a library (requests) that is very simple to use if you want to grab a text file from a URL on the web.

r = requests.get('https://raw.githubusercontent.com/DFHack/df-structures/master/v0.40.01.lst');

In this case, r.text contains the content returned from doing a GET on the URL specified. Because the URL points to a plaintext file, r.text needs no further processing, and contains the entire content of v0.40.01.lst.

Now, to find out how many of each status message there is, I could have run an regex. But this case doesn’t need the many features of regexes, since I don’t have any patterns to match other than the exact, unchanging strings.

    unchecked = 0
    aligned = 0
    verified = 0
    unknown = 0
    unknowns = []
    
    text = r.text.split("\n")
    for line in text:
        strs = line.split(":STATUS :") # Last part should be the status.
        status = strs[-1]
        if status == "UNCHECKED":
            unchecked += 1
        elif status == "ALIGNED":
            aligned += 1
        elif status == "VERIFIED":
            verified += 1
        else:
            unknown += 1
            unknowns.append(line)

Since the maintainers of the file stick to the exact format (it seems to be generated by a script), I can split every line into “before :STATUS :” and “after :STATUS :“, and count how many of each status there is. Also, in case the maintainers have a differently formatted line, I append the line in question to a list of unknowns to aid in debugging. However, over around two weeks of running the script, the only content of unknowns has been a newline at the end of the file.


Next, I create the graph itself. I use matplotlib (which is also known as pyplot, though they are not quite the same) to draw the graph. Because the image has to have a short vertical axis and a longer horizontal axis, I opt for a horizontal bar graph.

    mydpi = 96
    f = plt.figure(figsize=(200.0/mydpi, 30.0/mydpi), dpi=mydpi)
    plt.axis([0,verified+aligned+unchecked, 0.1, 0.2])
    p1 = plt.barh(0.1, verified, height=0.1, color='g')
    p2 = plt.barh(0.1, aligned, left=verified, height=0.1, color='y')
    p3 = plt.barh(0.1, unchecked, left=verified+aligned, height=0.1, color='r')
    frame = plt.gca()
    frame.axes.get_yaxis().set_visible(False)
    frame.axes.get_xaxis().set_ticks(np.arange(0, verified+aligned+unchecked, 100))
    for label in frame.axes.get_xticklabels():
        label.set_visible(False)
    plt.text(-100, 0.03, "%d/%d/%d=%d%% done" % (verified, aligned, unchecked, (100*verified)/(verified+aligned+unchecked))) 
    print "Saving graph ..."
    plt.savefig("/home/skyrunner/webserver/resources/progressbar.png", dpi=mydpi, bbox_inches='tight')

This short bit of code actually took some time to figure out, because configuring the graph was surprisingly difficult.

Line by line:

mydpi = 96
f = plt.figure(figsize=(200.0/mydpi, 30.0/mydpi), dpi=mydpi)

plt.figure returns a Figure. plt doesn’t use pixels to define image sizes, so a dpi has to be set. Theoretically, image pixel width = image inch width * [dots per inch]. However, plt uses the figure size as more of a suggestion than a limit for the image size; they usually end up slightly larger than 200×30.

plt.axis([0,verified+aligned+unchecked, 0.1, 0.2])
p1 = plt.barh(0.1, verified, height=0.1, color='g')
p2 = plt.barh(0.1, aligned, left=verified, height=0.1, color='y')
p3 = plt.barh(0.1, unchecked, left=verified+aligned, height=0.1, color='r')

I wanted a horizontal graph, so I put down three barhs, specifying where each bar starts and how wide it is. The order of the progress bar is finished, partially finished (‘aligned’), and unchecked.

Line 46 defines the axis dimensions so that there are no visible axes: the width is exactly the width of the graph, and the height is exactly the height of the graph.

frame = plt.gca()
frame.axes.get_yaxis().set_visible(False)
frame.axes.get_xaxis().set_ticks(np.arange(0, verified+aligned+unchecked, 100))
for label in frame.axes.get_xticklabels():
    label.set_visible(False)

Next, the ‘frame’ for the graph is found, and I hide the y-axis. This is because the y-axis for this graph is meaningless, and if it was enabled, it would look like this:

progressbar_withY

On line 52, using numpy’s arange() I get an array of numbers between 0 and the sum of all three statuses with an interval length of 100 and define the position of the horizontal ‘ticks’ in the bar. Originally there were no ticks, but they were added to help make the graph less boring. In the for loop, the labels are disabled, because like with the Y-axis labels, they simply make the graph look dirty. My image has limited space, and sadly the labels for the ticks are not needed.

plt.text(-100, 0.03, "%d/%d/%d=%d%% done" % (verified, aligned, unchecked, (100*verified)/(verified+aligned+unchecked))) 
print "Saving graph ..."
plt.savefig("/home/skyrunner/webserver/resources/progressbar.png", dpi=mydpi, bbox_inches='tight')

Finally, a line of text is added to explain the importance of the graph — what percent of it is done, and how many things have to be done.

The image is saved as a png format in the resources/ directory of my webserver. Cherrypy allows files to be accessed directly if you designate a directory as such. My resources/ directory is given an alias of images/.

You might ask why the path is hardcoded, instead of relative. That is because I use a cron task to run the script every hour and log the results to a file. cron requires absolute paths for everything, as it does not have the typical environmental variables as a typical shell does.

This is the line added to the crontab:
0 * * * * /usr/bin/python /home/skyrunner/webserver/makeDFGraph.py>>/home/skyrunner/webserver/dfgraph.log

Although cron jobs pipe all output to system mail, I also append the messages to a log file so that it’s easier to check issues chronologically.


Results

DF graph hits

I have had a total of 1061 clicks as of the time of writing to the graph. These clicks were recorded by using a goo.gl link in my signature. However, I estimate that there were at least three times more views, simply because the goo.gl link was not the only way people could have accessed my graph. The friend that asked me to create the graph also embedded it raw in his forum signature (as in, not using goo.gl), and after a few days the official thread for DFhack included the graph in the first post of the forums thread (also known as the ‘OP’). In fact, that is why I think the clicks rapidly dropped off — it’s much easier to view the graph if it’s in a prominent place like the first post of the official thread instead of a random link in a random forum-goer’s signature.

My friend has told me that the maintainers of the DFhack repository learned that I made a progress bar, and made sure to update their status file at least occasionally so my progress bar also went up over time.

I feel that this quick script has helped many, many people, which is a first for me. Usually, my projects are for my personal satisfaction. All in all, the progress bar was a success by all measures. However, I should have considered a better method of distribution so I know exactly how many people used my graph. A possible way to do that would have been using cherrypy to create a dynamic webpage that simply returns the requested image and increments a counter.

[repository]

Single Pendulum in Javascript

Tags

,

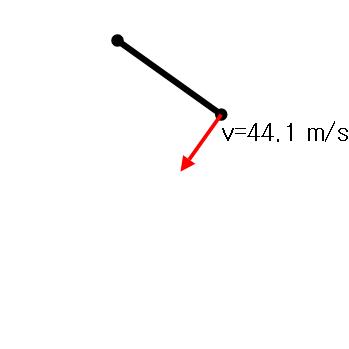
pendulum_arrows_text

Simulations have always been a favorite area for me. As the first step in a small project to simulate a double pendulum, I’ve started with a single pendulum. Simulating a pendulum numerically is a pretty hefty task. It involves quite a bit of vector math, and there are many ways to decide how to describe the system. (Demo)

I used a web browser to deliver this app, using SVG’s vector graphics to draw clean, crisp pendulum and arrows, Javascript for the actual simulation, and a Javascript library (d3) to bind the simulation and the SVG representation together.


The simulation:

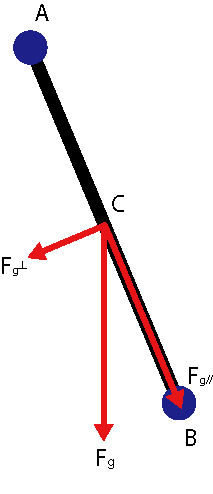
pendulum forces

Points A and B are represented as Node objects, with the member variables \overrightarrow{Position} and isFixed. \overrightarrow{Position} is a Vector3 object encapsulated by Node.

As an aside, Javascript is a weakly typed language, but if I were to represent the Vector3 class in a explicitly/strongly typed one, the class definition would look something like this (all members are public):

class Vector3 {
    Vector3(double xyz1[3]);
    Vector3(double xyz1[3], double xyz2[3]);
    double xyz[3];
    Vector3* divideBy(double num);
    Vector3 divide(double num);
    Vector3* multiplyBy(double num);
    Vector3 multiply(double num);
    Vector3* addBy(Vector3 right);
    Vector3 add(Vector3 right);
    Vector3 cross(Vector3 right);
    double dot(Vector3 right);
    Vector3* normalize();
}

To be honest, Javascript is not the best language to create a physics simulation in. For one, the weak typing often makes it impossible to tell between functions like the above at a glance. For example, the difference between Xby and X is simply that one does the action on the vector the function is called on, and the other creates a new vector and returns that. Another reason is its lack of function overloading , meaning that I cannot create an alternative constructor that accepts a Vector3 rather than a 3-long array. I also can’t have actual operators instead of the .addBy() and .cross(X) I am forced to use now. However, I can use method chaining to at least simulate multiple operations. All of the functions except dot() return a Vector3 object, meaning something like the following:

this.angVel.addBy(new Vector3(this.node2.getXYZ(), this.node1.getXYZ()).cross(F).multiplyBy(timestep));

is possible. Of course, it would have been something like

angVel += Vector3(node2, node1).cross(F) * timestep;

in C++.


Returning to the model, a Rod is represented by a Rod object, which has members node1/node2 (both Node objects), \overrightarrow{angVel}, mass, \overrightarrow{v}, I (which is the moment of inertia for a thin, evenly dense rod). It also has functions to apply force to the center of mass (applyForceToCoM()), ‘step’ the simulation by a certain amount of simulation time (step()), and to calculate the moment of inertia (calculateIntertia()). In the single pendulum’s case, there is only 1 force applied to it, and it is always applied to the center of mass. When I implement the double pendulum I will have to add a function that applies force to the end of the rod.

This is the function that calculates the change in the physical properties when force is applied:

// should be bound to a Rod. F is a Vector3 in units of Newtons.
function applyForceToCenterOfMass(F) {
    // if both ends are fixed, nothing happens.
    if (this.node1.isFixed && this.node2.isFixed)
        return;
    // if both ends are free, the mass simply gains velocity.
    else if (!this.node1.isFixed && !this.node1.isFixed) {
        this.velocity.addBy(F.divide(this.mass).multiplyBy(timestep));
    }
    // if one end is free, it becomes TORQUE!
    else {
        this.velocity.multiplyBy(0); // make sure the velocity vector stays 0.
        if (this.node1.isFixed)
            this.angVel.addBy(new Vector3(this.node1.getXYZ(), this.node2.getXYZ()).cross(F).multiplyBy(timestep));
        else
            this.angVel.addBy(new Vector3(this.node2.getXYZ(), this.node1.getXYZ()).cross(F).multiplyBy(timestep));        
    }
}

If both ends or no ends are fixed, then the rod either is not changed or gains velocity and no angular velocity, because applying force to the center of mass does not cause a mass to rotate.

Assuming node1 is fixed, it is true that the torque on the rod is

\tau = I\alpha = F_\perp l = p_{node1->CoM} \times F

where I, F, and p are all vectors. p_{node1->CoM} is a position vector from node1 to the center of mass; \tau = r \times F is a formula for torque.

I\alpha = p_{node1->CoM} \times F
\alpha = \frac{p \times F}{I}

Finally, the rod’s angular velocity increases by \alpha \ast timestep. Timestep is usually [0.0001, 0.001]; larger time steps tend to make the system look too stuttery, and smaller steps make the simulation look like it is moving in slow motion.


Once we have the new angular velocity, it is time to rotate the rod accordingly.

function step() {
    if (this.node1.isFixed && this.node2.isFixed)
        return;
    if (!this.node1.isFixed && !this.node1.isFixed) {
        node1.position.addBy(velocity.multiply(timestep));
        node2.position.addBy(velocity.multiply(timestep));
    }
    else if (this.node1.isFixed) {
        var P = new Vector3(node1.getXYZ(), node2.getXYZ());//position vector
        var res = rotateVector(P, this.angVel.multiply(timestep));
        node2.position = node1.position.add(res);
    }
    else {
        var P = new Vector3(node2.getXYZ(), node1.getXYZ());//position vector
        var res = rotateVector(P, this.angVel.multiply(timestep));
        node1.position = node2.position.add(res);
    }
}

The important part is rotateVector(), which is the following:

function rotateVector(rotated, rotation) {
    var angle = rotation.getLength();
    var k = new Vector3(rotation.xyz).normalize(); // get the unit vector that represents the axis to be rotated around.
    var temp1 = rotated.multiply(Math.cos(angle));
    var temp2 = k.cross(rotated).multiplyBy(Math.sin(angle));
    var temp3 = k.multiply(k.dot(rotated) * (1 - Math.cos(angle)));
    temp1.addBy(temp2).addBy(temp3);
    return new Vector3(temp1.xyz);
}

This is an implementation of Rodrigues’ rotation formula, an elegant way to rotate any vector by any direction around a given axis.

v_{rot} = v \cos \theta  + (k \times v) \sin \theta + k(k \cdot v)(1 - \cos \theta)

Because conventions, the angular velocity of the rod must be divided into two parts–the normalized form of the angular velocity (new Vector3(rotation.xyz).normalize()), which is k in the formula, and the length of the angular velocity, which becomes θ in the formula.

And with this, one timestep has been finished, and the entire code starts over.


One final note: Another reason Javascript is bad for simulations is that it has no type checking, unlike Python. I spent two to three hours debugging Javascript using the Firefox debugger (which is quite functional and easy to use), when the problem was simple. I was passing wrong objects around. For example, the Vector3 constructer accepts one or two arrays of length 3 or more. I was first passing a Node, then a Vector3 to it, causing undefined to appear in places and ruining all calculations.

More OO: changing behaviour with predicates

I’ve talked about the way port cities are placed previously. But having only port cities simulated makes the whole thing a bit ad hoc–things are magically produced and disappear with no bigger logic to them. Instead of creating a new class that is similar to randomBoat except it places villages (instead of port cities) and moves around on the land (instead of the sea), I decided to mix a little inheritance into the situation.

bool randomBoat::explore(WorldMapClass& wm)
{
    uniform_int_distribution<> dist(50, 100);
    int moves = dist(gen);
    int failures = 0;
    while (moves > 0)
    {
        bool result = tryMove(wm); /// discount failed moves
        auto it = wm.ref(currentPosition.first, currentPosition.second);

        path.push_back(pair<coord, int>(currentPosition, faction));

        if (it.isCoastal && it.isInZOC == 0)
        {
            wm.ref(currentPosition.first, currentPosition.second).isCity = true;
            wm.cities.push_back(currentPosition);
            int cityCode = wm.cities.size();
            recursiveZOC(currentPosition.first, currentPosition.second, wm, 5);
            return true;
        }

        if (!result)
        {
            moves++;
            failures++;
            if (failures > 20)
                return false;
        }
        moves--;
    }

    return false;
}
bool randomBoat::tryMove(WorldMapClass & wm) // return true if succeeded.
    {
        uniform_int_distribution < > dist(0, 2);
        int originX = startingPosition.first - currentPosition.first;
        if (originX != 0)
            originX = originX > 0 ? 1 : -1;

        int originY = startingPosition.second - currentPosition.second;
        if (originY != 0)
            originY = originY > 0 ? 1 : -1;

        int vertical, horizontal;
        do {
            vertical = dist(gen) - 1;
            horizontal = dist(gen) - 1;
        } while (vertical == 0 && horizontal == 0 && (vertical == originY || horizontal == originX)); //While invalid & in the direction of origin

        auto it = wm.ref(currentPosition.first + horizontal, currentPosition.second + vertical);
        if (!it.isNull && (it.isCoastal || it.altitude < 0)) {
            currentPosition.first += horizontal;
            currentPosition.second += vertical;
            if (it.isCoastal)
                startingPosition = currentPosition;
            return true;
        }

        return false;
    }

It looks like the two highlighted lines of code are all that need to be changed in order to get the behaviour I want. In explore() line 13, the condition is checking that the tile the boat is on is both a coast and not in the zone of control of another city, in order to place a city there. And in line 19 of tryMove(), whether the tile the boat is trying to move is valid is tested: tiles must exist, and has to be either a coast or sea. If the first predicate is changed to check that the tile is land and not a coast and not in the ZoC of another city/village and if the second one becomes “must be either a coast or land”, the rest of the logic can be left identical. Also, the part of the code where the tile is set to be a city must also be packaged into a virtual function, because we don’t always want to set something to be a city.

Therefore, I change lines 13 and 19 of explore() and tryMove() respectively:

if (cityCondition(it))
if (!it.isNull && moveCondition(it))

Lines 13~20 of explore() are also changed:

if (cityCondition(it))
    {
        setTileAs(wm, currentPosition);
        recursiveZOC(currentPosition.first, currentPosition.second, wm, ZoCSize);
        return true;
    }

cityCondition() and moveCondition() are made into virtual bool functions, and I create a randomBoat_Land class that inherits from randomBoat:

class randomBoat_Land : public randomBoat
{
public:
    randomBoat_Land(const coord& dim, const int& ffaction = 1, unsigned long int seed = 1243523642, const coord& start = coord(-1, -1));
    bool cityCondition(const maptile& tile);
    bool moveCondition(const maptile& tile);
    void setTileAs(WorldMapClass& wm, const coord& pos); // sets to town
};

And just like that it all works.

Inland cities

In C++, pointer to reference is illegal

Tags

, ,

In order to generate items suitable to the biome, I wanted to create an index of lists of items mapped to biomes so that retrieving the correct items would be easy.

The most logical way would seem to be having a list of references to a single copy of items and randomly pulling an item from it.

std::map itemsByBiome;

At a glace, it seems like it should work. But the compiler spits out a series of warnings that get the point simple and clear:

Error	5	error C2528: 'pointer' : pointer to reference is illegal	d:\programs\vc\include\xmemory0	516	1	ChartedWaters
Error	6	error C2528: 'const_pointer' : pointer to reference is illegal	d:\programs\vc\include\xmemory0	517	1	ChartedWaters
Error	8	error C2528: '_Ptr' : pointer to reference is illegal	d:\programs\vc\include\xmemory0	586	1	ChartedWaters
Error	9	error C2528: '_Ptr' : pointer to reference is illegal	d:\programs\vc\include\xmemory0	591	1	ChartedWaters
Error	10	error C2528: 'pointer' : pointer to reference is illegal	d:\programs\vc\include\xmemory0	683	1	ChartedWaters
Error	11	error C2528: 'const_pointer' : pointer to reference is illegal	d:\programs\vc\include\xmemory0	684	1	ChartedWaters
Error	13	error C2528: '_Ptr' : pointer to reference is illegal	d:\programs\vc\include\xmemory0	861	1	ChartedWaters
Error	14	error C2528: 'abstract declarator' : pointer to reference is illegal	d:\programs\vc\include\xmemory0	105	1	ChartedWaters
Error	15	error C2528: 'abstract declarator' : pointer to reference is illegal	d:\programs\vc\include\xmemory0	107	1	ChartedWaters
Error	16	error C2528: 'pointer' : pointer to reference is illegal	d:\programs\vc\include\xmemory0	122	1	ChartedWaters
Error	17	error C2528: 'const_pointer' : pointer to reference is illegal	d:\programs\vc\include\xmemory0	123	1	ChartedWaters
Error	18	error C2528: '_Pval' : pointer to reference is illegal	d:\programs\vc\include\vector	797	1	ChartedWaters
Error	21	error C2528: '_Ptr' : pointer to reference is illegal	d:\programs\vc\include\vector	1581	1	ChartedWaters
Error	22	error C2528: '_Pval' : pointer to reference is illegal	d:\programs\vc\include\vector	1745	1	ChartedWaters

It does seem slightly counter-intuitive. In other languages where objects are passed by reference by default the above code would pretty much work. But in C++ specifically, references are like aliases for objects and don’t necessarily have memory addresses of their own. The C++ standard has the following to say about references (taken from the January 2012 working draft freely available) on pages 360~362:

[in context of template argument deduction] If a substitution results in an invalid type or expression, type deduction fails.

— Attempting to create a pointer to reference type.

Additionally, on page 178,

4 It is unspecified whether or not a reference requires storage (3.7).
5 There shall be no references to references, no arrays of references, and no pointers to references. The
declaration of a reference shall contain an initializer (8.5.3) except when the declaration contains an explicit
extern specifier (7.1.1), is a class member (9.2) declaration within a class definition, or is the declaration
of a parameter or a return type (8.3.5); see 3.1. A reference shall be initialized to refer to a valid object
or function. [ Note: in particular, a null reference cannot exist in a well-defined program, because the only
way to create such a reference would be to bind it to the “object” obtained by dereferencing a null pointer,
which causes undefined behavior. As described in 9.6, a reference cannot be bound directly to a bit-field.
—end note ]

So by design C++ does not allow pointers to references, which happen when one attempts to iterate over a vector of references. Because pointers are often interchangable with references, switching the std::maps to use pointers quickly solves this problem.

libtcod and deep copying

Tags

,

Heap corruption, memory corruption, access violations… memory-related issues are often the most feared of a programmer’s foes (other than threading issues, of course). Memory bugs also often happen in C++ when working with member pointers: copying an object with a member pointer in it naively often causes the above problems, especially if the copied object is immediately deleted.

class HasPointer 
{
    public:
        TCODConsole* screen;
};

class Copied
{
    public:
        Copied(int w, int h);
        HasPointer hp;
};

std::vector<Copied> holder;
holder.push_back(Copied(100, 200)); /// may cause memory corruption

This is because the compiler takes the unnamed object Copied(100,200) and copies it to holder. Since I have no copy constructor, the compiler generates a constructor that looks like this:

Copied::Copied(const Copied& old)
: hp(old.hp)
{

}

HasPointer also doesn’t have a copy constructor, so the following is generated:

HasPointer::HasPointer(const HasPointer& old)
: screen(old.screen)
{

}

screen and old.screen point to the same place in memory. However, there are no problems yet.. until the unnamed object is discarded. Then, attempting to access `holder.back().screen“ will cause a memory error.

I have to write a copy constructor that deep-copies, or copies the actual value referenced by the pointer rather than the pointer itself.

HasPointer::HasPointer(const HasPointer& old)
{
    screen = TCODConsole(screen);
}

It seems all and well (the libtcod library tends to accept pointers for large objects in all functions because it is based on C). But the memory error stays…

Though documentation for libtcod is sparse on this subject, the TCODConsole(TCODConsole*) constructor does not seem to deep-copy the console. Instead, it does the same thing pointers do, copy the old address. Instead, I had to do this:

HasPointer::HasPointer(const HasPointer& old)
{
    int w = old.screen->getWidth();
    int h = old.screen->getHeight();
    screen = new TCODConsole(w, h);
    TCODConsole::blit(old.screen, 0, 0, 0, 0, screen, 0, 0); // copy all the contents of old.screen to screen.
}

Perhaps my frustration could have been prevented if I didn’t believe TCODConsole(TCODConsole*) copied the contents as I expected, rather than copying the pointer.